Reorder point formula and safety stock: how to calculate both
The reorder point formula and a simple safety stock formula, with a worked example and an Excel or Google Sheets layout you can copy for a small shop.

Some links on this page may be affiliate links. If you buy through them we may earn a commission, at no extra cost to you. How this works.
Running out of a best-seller costs you sales. Ordering too much ties up cash in boxes on a shelf. The reorder point is the simple number that sits between those two problems: when stock falls to it, you place a new order.
You do not need special software or statistics to calculate it. Two formulas and a spreadsheet are enough to get started.
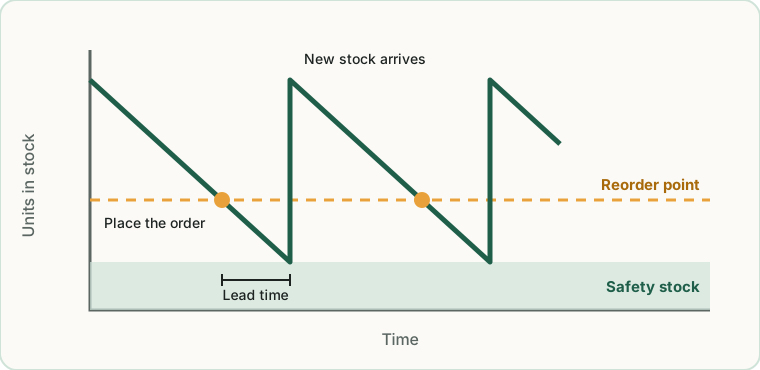
The three numbers you need
For each product, find:
- Average daily sales. Units sold over a period, divided by the number of days. Use the last 30 to 90 days.
- Lead time. The number of days between placing an order with your supplier and having the stock ready to sell. Include production, shipping, customs and the time you need to unpack.
- Safety stock. A buffer that protects you when sales are faster or deliveries slower than usual.
Formula 1: reorder point
Reorder point = (average daily sales × lead time in days) + safety stock
The first part, average daily sales × lead time, is the stock you will sell while waiting for the delivery. Safety stock is the cushion on top.
Formula 2: a simple safety stock
There are sophisticated ways to calculate safety stock. For a small shop, this simple method works well:
Safety stock = (maximum daily sales × maximum lead time) − (average daily sales × average lead time)
It asks: “What if my busiest sales days happen during my slowest delivery?” and keeps enough to cover the difference.
A worked example
You sell a ceramic mug. Over the last 90 days:
| Value | |
|---|---|
| Average daily sales | 4 mugs |
| Busiest daily sales | 6 mugs |
| Average lead time | 10 days |
| Longest lead time | 14 days |
Safety stock = (6 × 14) − (4 × 10) = 84 − 40 = 44 mugs
Reorder point = (4 × 10) + 44 = 84 mugs
So when your stock of mugs falls to 84, it is time to order. In a normal cycle you will sell about 40 during the wait and still have 44 left when the delivery arrives. In a bad cycle, the buffer absorbs the shock.
How much should you order?
The reorder point tells you when to order, not how much. A practical starting rule:
Order quantity = average daily sales × number of days you want the order to cover
If you want each mug order to last about 45 days: 4 × 45 = 180 mugs. Then adjust for real-life constraints: supplier minimums, price breaks, storage space and cash available.
For a more precise answer that balances ordering costs against storage costs, use the economic order quantity (EOQ) formula.
Put it in your spreadsheet
Add these columns to your stock sheet, one row per product variant. If you do not have a stock sheet yet, see how to make an inventory spreadsheet.
| Column | Example |
|---|---|
| SKU | MUG-BLU-12 |
| On hand | 97 |
| Average daily sales | 4 |
| Lead time (days) | 10 |
| Safety stock | 44 |
| Reorder point | = average daily sales × lead time + safety stock |
| Status | “REORDER” if on hand ≤ reorder point, otherwise “OK” |
Add a conditional format that colors the row when the status is “REORDER” and you have a basic alert system. If your SKUs are messy, our guide to creating SKU numbers will help first.
Common mistakes
- Using one number for the whole year. If your sales are seasonal, recalculate before each busy period using last year’s numbers for the same season.
- Forgetting part of the lead time. Count from the day you order to the day stock is on your shelf, not just the shipping time.
- Ignoring stock already on order. When you check whether to reorder, compare the reorder point with stock on hand plus stock already ordered but not yet received.
- Setting it once and forgetting it. Review the numbers every few months, or whenever a supplier changes its delivery times.
- Treating every product the same. A large buffer makes sense for best-sellers; slow movers can run leaner. Inventory turnover shows which products are which.
When a spreadsheet is no longer enough
Once you have many products or sell on several channels, updating daily sales by hand becomes the weak point. Inventory software calculates sales velocity for you and sends low-stock alerts automatically. Our guide on spreadsheets versus inventory software covers the signs that it is time to switch.
Key takeaways
- Reorder point = average daily sales × lead time + safety stock.
- A simple safety stock covers your busiest sales during your slowest delivery.
- Count stock already on order before placing a new one.
- Review the numbers each season and when suppliers change.
Related guides

Best free inventory software for small business: 4 options that are really free
Free inventory software exists, with tight limits. Zoho Inventory, Sortly, a spreadsheet and your store's own stock tracking compared, with what each allows.

Economic order quantity (EOQ): formula, example and spreadsheet
The economic order quantity (EOQ) formula explained in simple words, with a worked example, an Excel and Google Sheets formula, and its limits.

FIFO vs LIFO: inventory methods explained with a simple example
FIFO vs LIFO vs weighted average explained with one worked example: how each method changes cost of goods sold, ending inventory and profit.